Daily Sales Summary |
  
|
Daily Sales Summary |
|
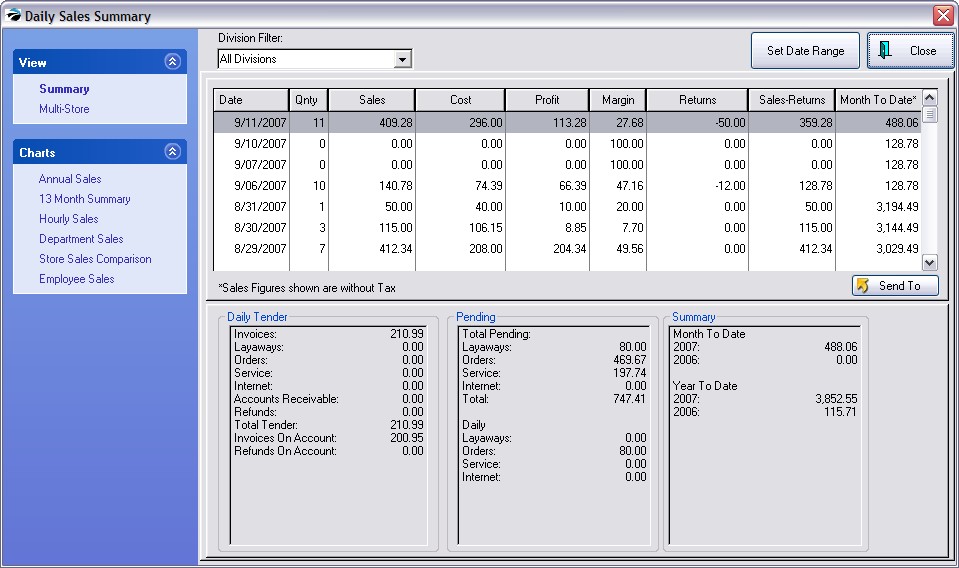
Each day's totals are tabulated and displayed in this consolidated screen. Note that Sales Figures do not include sales tax, however, Daily Tender numbers do include the tax.
This screen includes a running total of Month To Date sales. You will see the number of invoices, total of sales, returns, and net after returns. Also a total of cost, profit and margin% for the day's receipts.
Division Filter - view invoices belonging to all divisions or a selected division
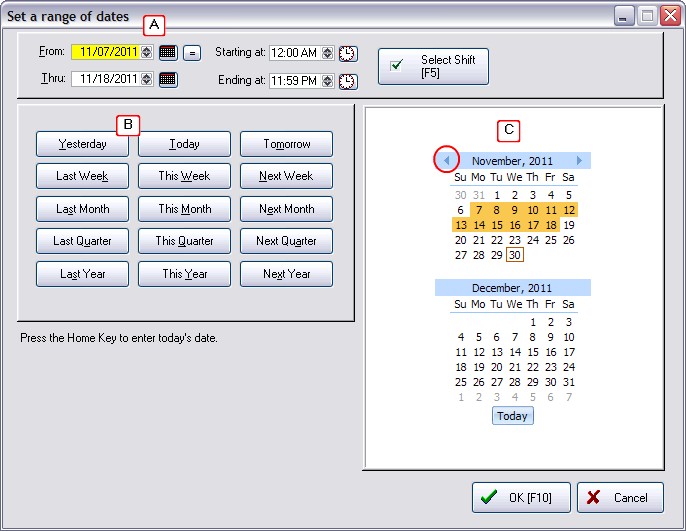
Set Date Range - choose the time period to be viewed, by using preset buttons or by selection of beginning and ending dates.
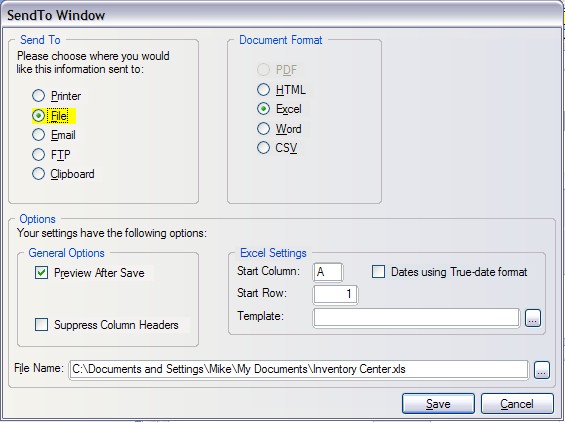
Send To - after filtering the data, you may choose to export the information to a variety of documents and formats.
· Daily Tender -Total Dollars taken in on this date for each sales category
· Pending - Dollar value of various transaction groups if all were converted to invoices
•Total Pending - Total Dollars of all pending transactions: orders, layaways, etc
•Daily - Total Dollars of pending orders, layaways, etc created on this date.
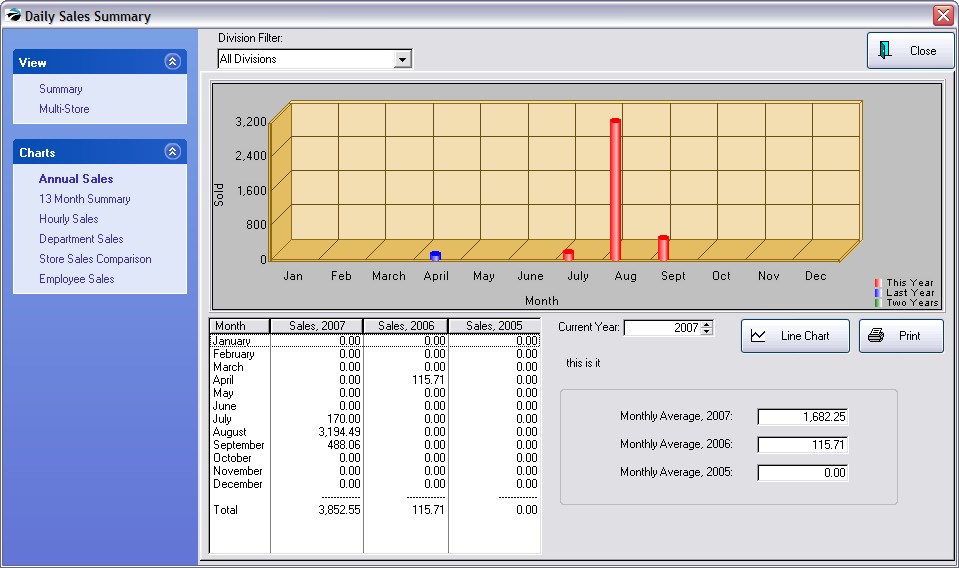
Summary
Month To Date Total Dollars in sales for this month compared with the same month of previous years.
Year To Date Total Dollars in sales to this point compared with the same date of previous years.
More information, some of which are best represented in graphs, is available on a Date Range, Division, and Store basis.
Total Dollars in sales for this month compared with the same month of previous years are visible as a graph and per month figures for 3 years at a time.
Current Year - can be adjusted to compare earlier years
Monthly Average - calculated for each of the displayed years
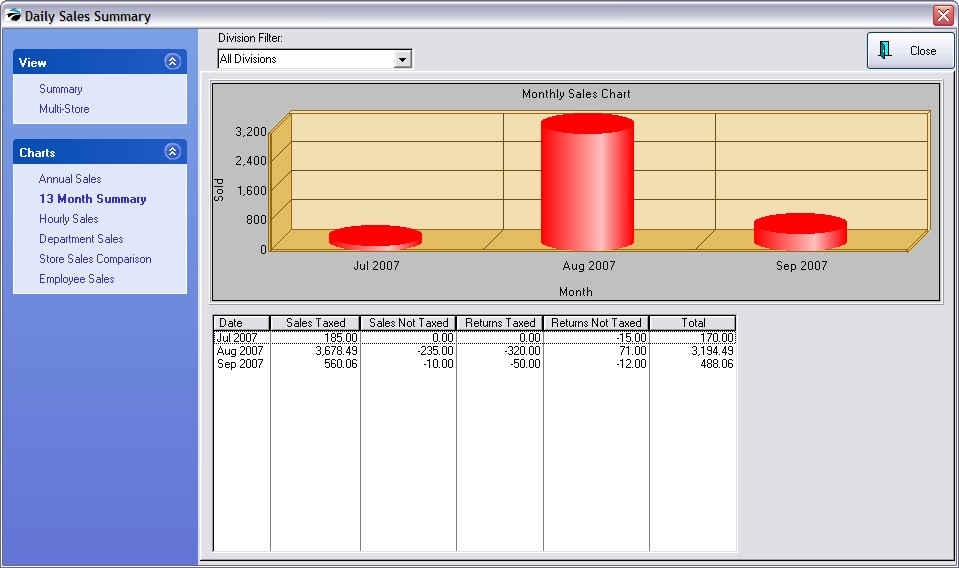
Will display current month and previous twelve months of sales by both taxable and non-taxable items. Returns are deducted from sales for a Total value.
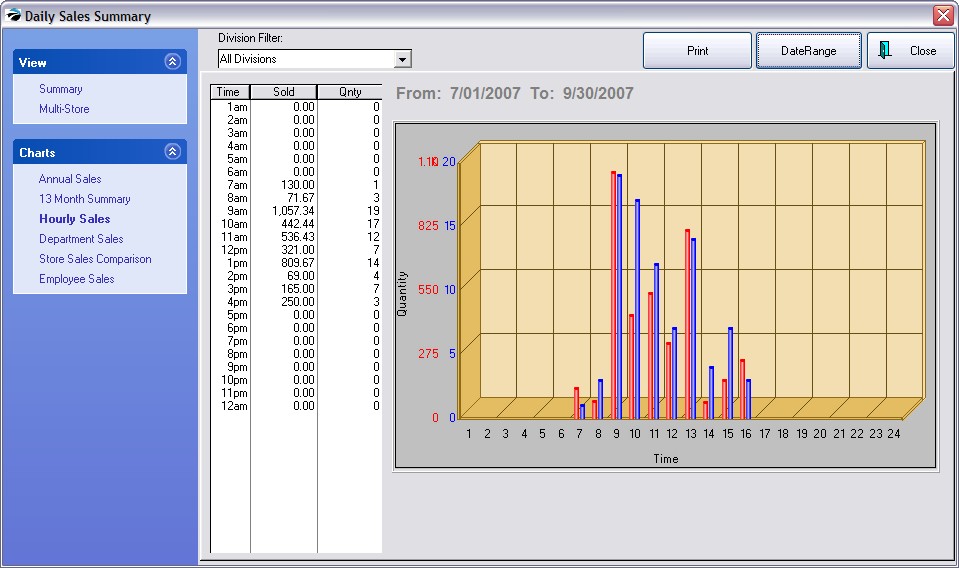
Filter by Divisions, and set a date range to get a total of dollars sold and number of invoices per hour of the day. The Print button will include both the graph and time chart.
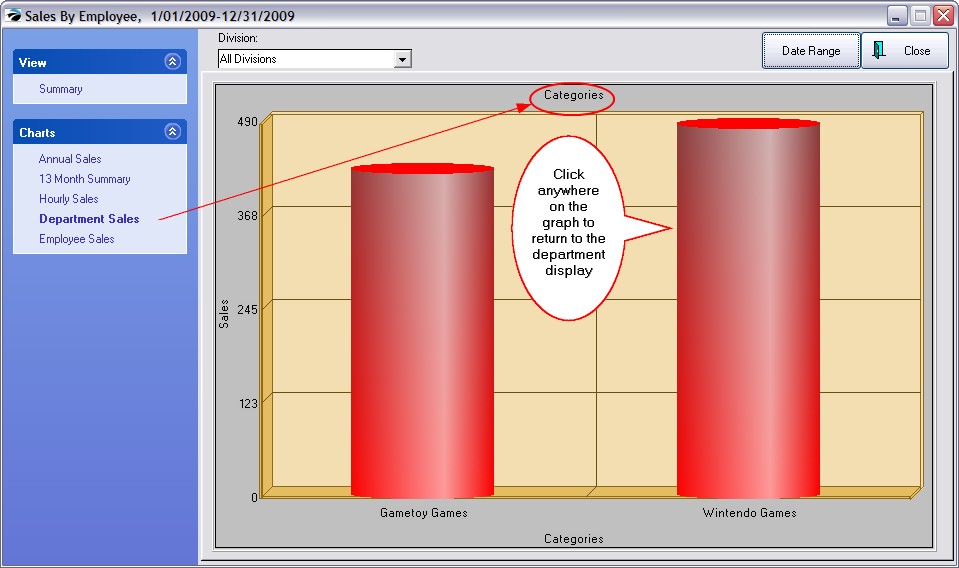
Select Divisions and a date range and all department sales totals will be graphed.
NOTE: if you have more than 15 departments this graph will not be able to display all of them.
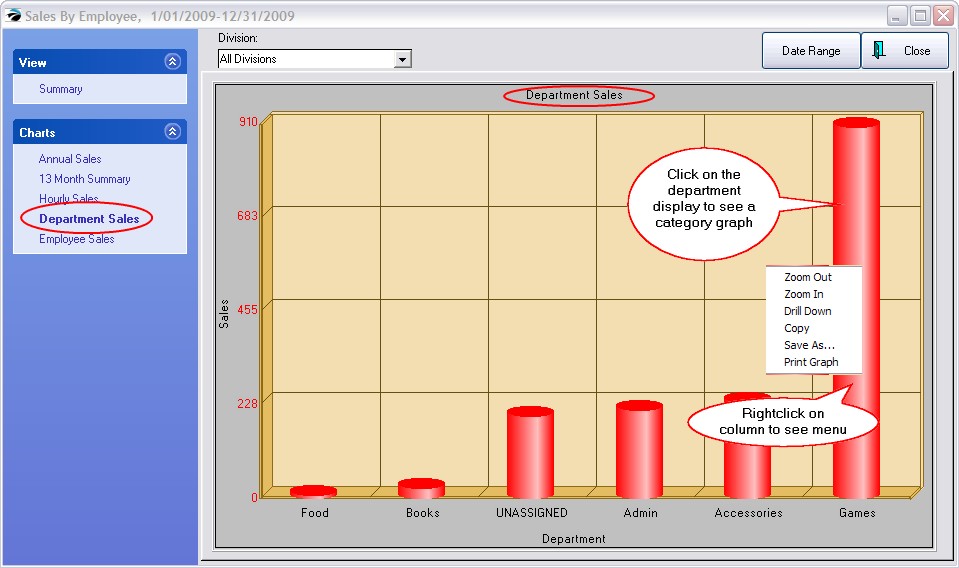
To see category graphs of a department, click on the department name. Each category will be displayed. Click anywhere on the graph to return to the department view.
This screen will show ALL departments affected during the selected sales period. If the data is tight and difficult to read, rightclick on the department column and choose one of the following options:
Zoom Out - reduces picture
Zoom In - enlarges picture
Drill Down - displays categories which are part of the selected department (Shortcut: just click on the column)
Copy - (not applicable)
Save As... - captures the graph image and saves as a picture file
Print Graph - sends graphic to printer
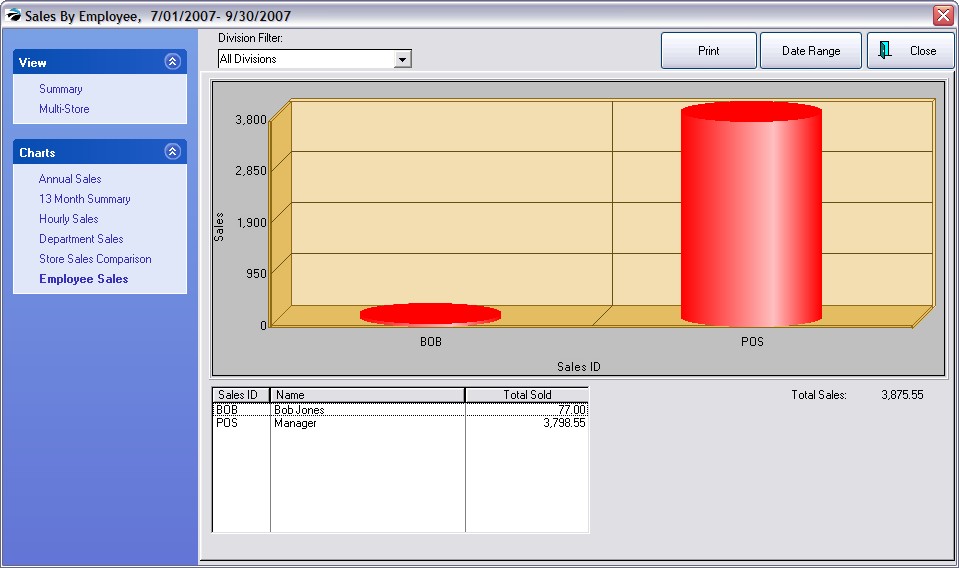
Select Divisions and a date range and total sales per employee will be graphed. The Print button will include both the graph and employee charts.